We all agree that customer satisfaction is the ultimate goal of a service center or IT support department. But when it’s time to dig and identify possible sources of improvement, the current IT manager wants to have a clear view of everyone’s performance.
Number of Tickets Created / Closed per Day
It is important to pay attention to certain basic metrics. While these are not the most complex indicators, they quickly give you insight into the daily workload of a team. Depending on the context, it is interesting to visualize everything and compare the type of tickets that have been created. Taking action on a volume of “change” tickets may have a higher priority than a series of reported incidents.
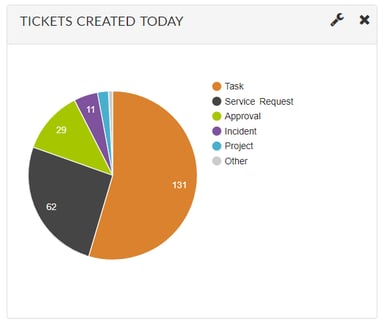
Same logic for the volume of closed tickets. By comparing the 2 metrics, we can quickly see if the number of closed tickets is insufficient (logically, you will have to take action if the volume of closed tickets is constantly lower than the number of incoming tickets).
Response Time and Resolution Time
If you make customers wait for hours for an answer, they will obviously not be very happy. The response time is an indicator of the most important, the one that represents the degree of responsiveness of your teams.
Customers seek confirmation that someone is handling their request within a reasonable time. If you have a policy or service level known to your customers, these indicators are for your metrics of choice.
The resolution time is the interval between the creation and closing of the ticket. Just to let you know, short response times do not necessarily show your high efficiency.
If your average response time is less than an hour, but your total resolution time is ten days, there is definitely room for improvement.
Remember to aim to resolve each ticket as quickly as possible with a minimum number of interactions with customers.
Incidents Without Known Resolution
This metric represents the number of tickets that could not be solved with known interventions. Several unresolved incidents can lead you to evaluate the quality of your agents’ actions or the appropriate use of a knowledge base.
Escalated Incidents
These are the number of incidents that had to be resolved by Level 2 or Level 3 team members. Growth in this type of incident could suggest gaps in the front-line team (Level 1).
Another option to consider for many Level 2 incidents is to rely on access to a self-service portal. This categorizes complex incidents to the help desk for better processing.
Incidents per Department
The number of incidents initiated by different teams in your organization shows which departments send the most service requests.
This indicator allows you to assign resources to the right tasks and to meet the most demanding business units (or the highest priority ones depending on the needs of the business). This metric makes sense in the context of the modernization of ITSM processes, where each department can benefit from effective management of internal services.
Number of Active Tickets
What are your people working on right now? Do they notice the priorities or are they overwhelmed by too many “active” notes?
This is the current number of reported incidents that have not yet been resolved. Active ticket growth can lead to growing customer dissatisfaction.
Cost per Contact
The cost per contact, or cost per ticket, is essentially the operating expenses amount of the service management organization divided by the volume of tickets or contacts. Typically, this is calculated on a monthly basis. Operating expenses often include: salaries and benefits for personnel, hardware, software, telecommunications and other related expenses.
The following table shows how support tickets (or contacts) are typically split between service requests and incidents.
First Call Resolution Rate
The first call resolution rate (RCF) is the percentage of problems that are correctly resolved during the first call with the client, eliminating any subsequent call or interaction on the problem.